An elevation profile shows the course of a route in a graph: the vertical y-axis represents elevation in meters, and the horizontal x-axis represents distance in meters. The result is a profile display where you can see the ascents and descents of a route.
Additional information
- In the app, places of interest are not displayed in the elevation profile for readability.
-
Where to find the elevation profile
- The elevation profile is available for each route under 'Statistics.'
- During navigation, you can display or disable the elevation profile of the route via the corresponding button on the map:
Additional information
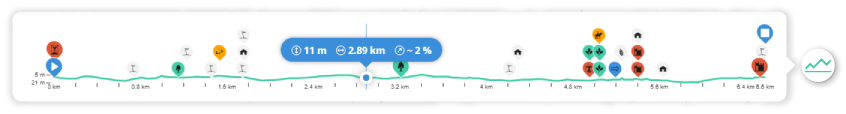
On the RouteYou elevation profile, we have visually integrated additional information:
- If there are places of interest associated with your route, they will also be displayed at the correct location along your elevation profile.
- If you use the RouteYou Turn-by-Turn navigation, your personal avatar will appear at your location on the elevation profile. This allows you to accurately track where you are along the route.
- When you hover over the route line on the map or the elevation profile on the website, a horizontal blue bar will appear at that location in the elevation profile, providing concise practical information. This tells you:
- the elevation at that specific location
Read here how RouteYou calculates elevation data - how far you have traveled from the starting point
- the gradient at the indicated location
- the elevation at that specific location
Where to Find the Elevation Profile
- During navigation, you can display or disable the elevation profile of the route via the corresponding button on the map:
This button is available on both the route detail page and in the route planner as soon as you start planning.
Frequently Asked Questions
A GPX file you import often includes elevation data, but that info can be unreliable or just plain wrong. If you choose not to recalculate the route during import, the elevation data from the original file is used. That can make the elevation profile look off or inaccurate — like totally flat, even if the terrain isn’t.
Want a more accurate elevation profile? Recalculate the route when importing. That way, RouteYou can add the correct elevation data based on the underlying network.